
Reinventing Linear Regulation for Space: Enhancement-Mode GaN-on-Silicon Power FETs × Enhanced Linear Regulators
Introduction
Spacecraft reserve linear regulators for the loads that can least tolerate noise: the local oscillators and low-noise amplifiers of RF and microwave front ends, the reference clocks behind high-speed data links, the receivers in electronic warfare and signals intelligence payloads, and the detectors in optical and precision-sensing instrumentation. A low-dropout linear regulator (LDO) generates no switching ripple of its own, attenuates the ripple that arrives at its input, and radiates nothing, because its pass transistor conducts continuously instead of switching.
Despite these benefits, two key drawbacks have limited the use case for linear regulation in space. First, the pass transistor has to survive the radiation environment; this has historically necessitated a radiation-hardened silicon MOSFET, with the single-event vulnerabilities as well as the size and on-resistance limitations of an aging power electronics technology [1]. Second, the entire input-to-output voltage difference is dissipated as heat, holding efficiency close to the ratio , so an LDO has only been practical for small voltage steps; larger steps, step-up, and voltage inversion have belonged to switching regulators, along with the inductors, filtering, and spectral clean-up challenges they bring.
EPC Space’s radiation-hardened enhancement-mode gallium nitride (eGaN) transistor addresses the constraint imposed by radiation survivability. Radiation-hardened silicon MOSFETs carry two ways for a single heavy ion to destroy them: it can rupture the thin gate oxide, or it can generate a cloud of holes and electrons in the drift region that burns the device out. An eGaN device has no gate oxide and no efficient path for hole conduction, so neither mechanism has anything to act on [1]. EPC7014, the pass transistor on every board in this note, is rated immune to single-event effects up to a linear energy transfer (LET) of 83.2 MeV·cm2/mg with the drain held at its full rated voltage, immune to total ionizing dose (TID) at both low and high dose rates, and it brings the low on-resistance and small footprint of a lateral GaN device to the pass element [2].
Polaris Semiconductor’s Enhanced Linear Regulator (ELR) addresses the second constraint by recovering most of the power a linear regulator would otherwise dissipate. Optocouplers with high power-transfer efficiency, placed in series with the pass transistor, convert part of the voltage drop into light, and their photovoltaic cells return that light to the output as current. Arranged one way, the optocouplers lift a step-down regulator’s efficiency well above the theoretical maximum of a conventional LDO; arranged another, their photovoltage augments the input to boost it, or extends below ground to produce a negative rail. Nothing switches in any of these configurations, so there is no switching ripple, no radiated emissions, and no inductor. The optocouplers are radiation-resilient by design, retaining most of their efficiency through high displacement damage doses and largely unaffected by TID and single-event phenomena [3].
In this application note, EPC Space and Polaris Semiconductor built four demonstration boards on one common design: an LDO baseline with no optocouplers, and Buck, Boost, and Inverting ELRs that each add two Polaris OC1D optocouplers. The LDO supplies a 1.8 V rail from a nearby input; the Buck ELR supplies the same rail from 5 V; the Boost ELR lifts a single-cell Li-ion battery to 5 V; and the Inverting ELR turns that same battery into a −1.8 V rail, all with one eGaN pass transistor and one controller. The sections that follow walk through the shared design and what changes between variants, then compare the boards on the basis of electrical, thermal, and noise performance.
eGaN × ELR Implementation
We built four designs for this application note: LDO, Buck ELR, Boost ELR, and Inverting ELR. Their target operational ranges are reported in Table 1 and simplified schematics are shown in Figure 1. For all designs, Analog Devices LT1575 [4], an ultrafast linear controller, drives EPC Space’s EPC7014 radiation-hardened eGaN HEMT [2]. LT1575 was chosen for its applicability to driving n-channel FETs as source followers and can be configured for 5 V gate drive—well-suited to EPC7014—along with its suite of features that we will expand upon below.
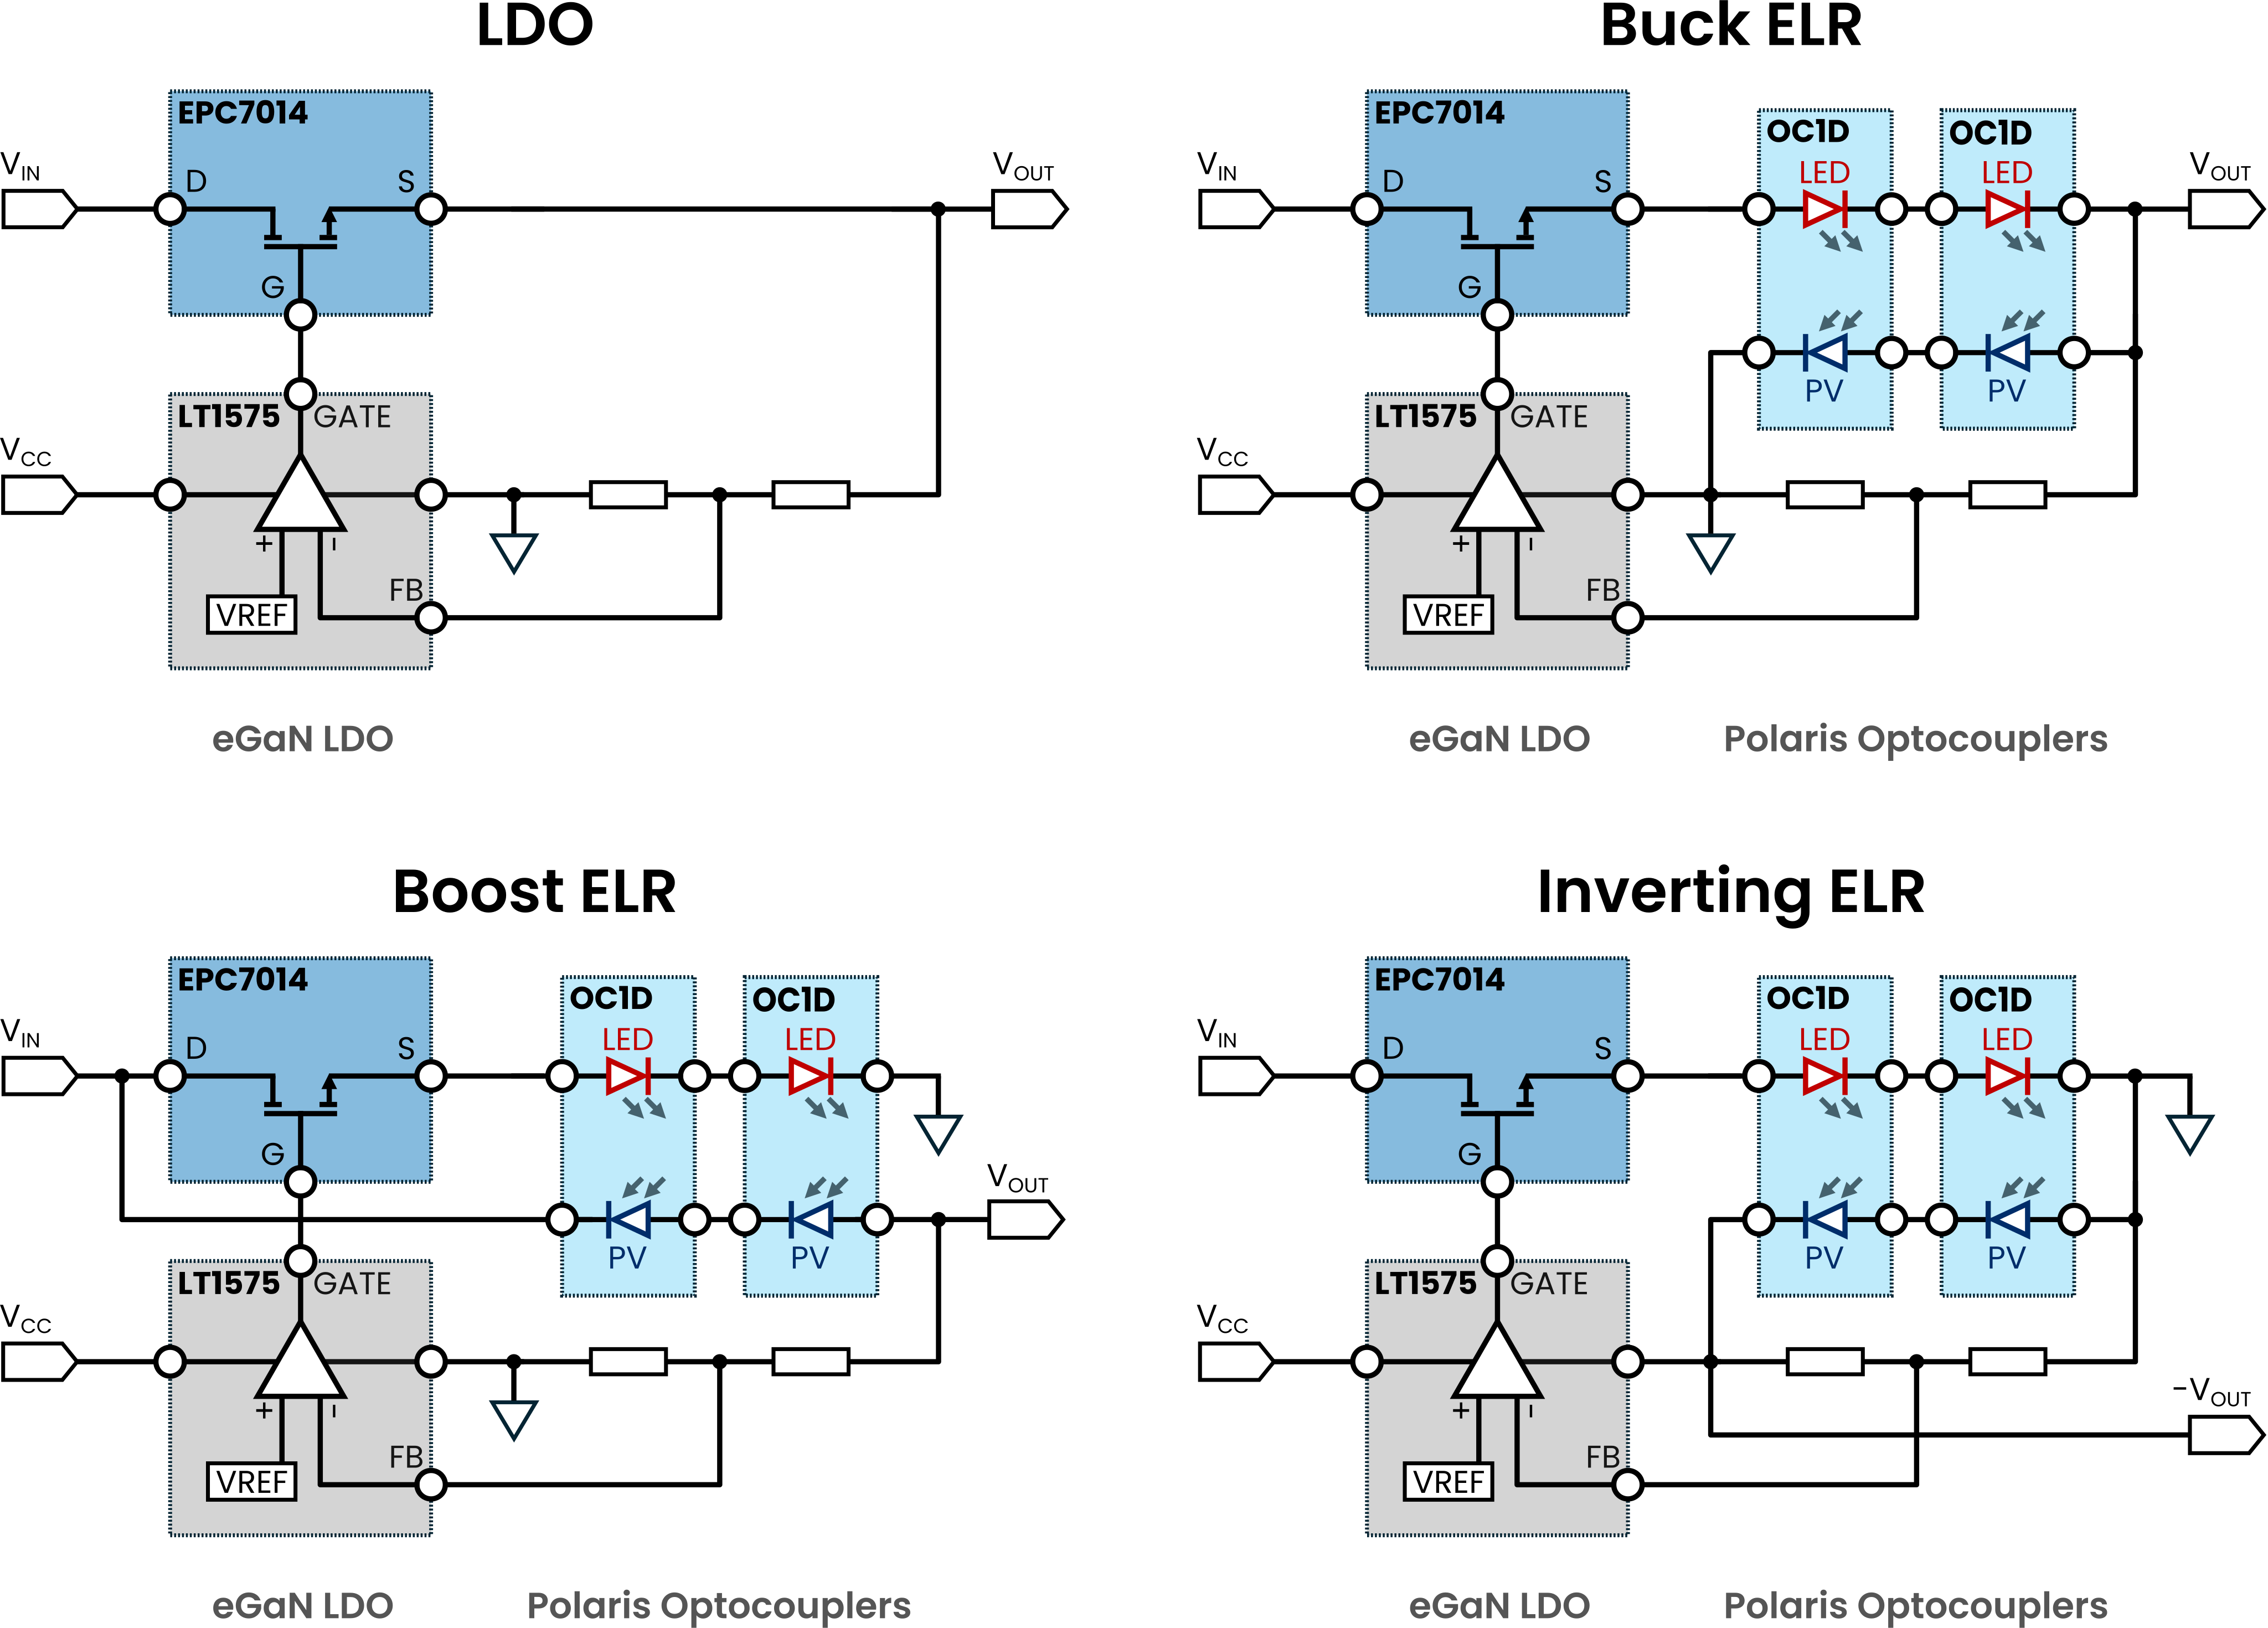
A dedicated bias rail () powers LT1575, whose feedback is set by a resistor divider connected between the output and ground. The three ELR variants extend the LDO base design, adding discrete Polaris OC1D optocouplers between the eGaN source, output, and ground terminals1 to enable a variety of regulated outputs—from efficient step-down across larger input-to-output differences (Buck ELR), to voltage boost (Boost ELR) and inversion (Inverting ELR). For a comprehensive understanding of ELR device operation, PSWP001 [3] details both Buck and Boost modes, and PSAN005 [5] details Inverting ELRs.
| Configuration | Typical Input Range | Nominal Output |
|---|---|---|
| LDO | 2–3 V | 1.8 V |
| Buck ELR | 4.8–6 V | 1.8 V |
| Boost ELR | 3.3–4.2 V | 5.0 V |
| Inverting ELR | 2.9–5 V | −1.8 V |
Shared Design Elements
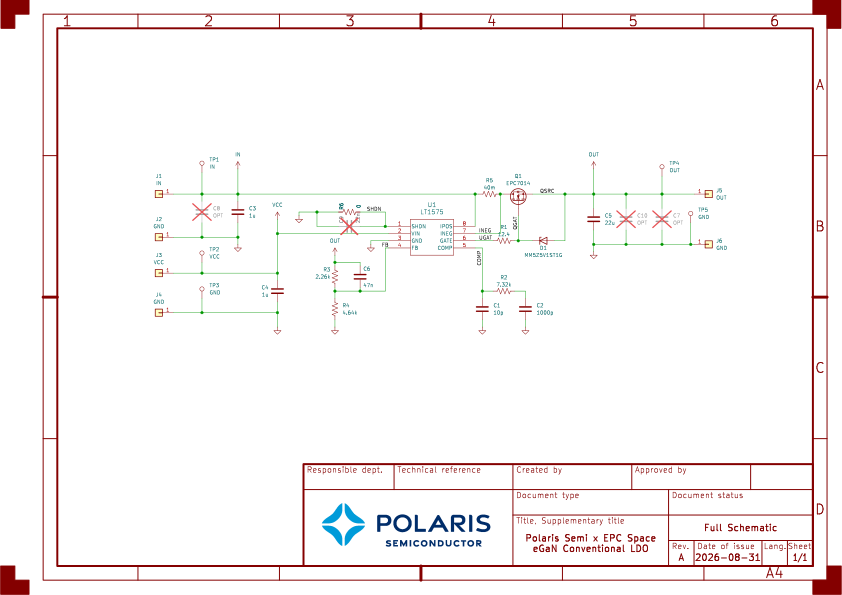
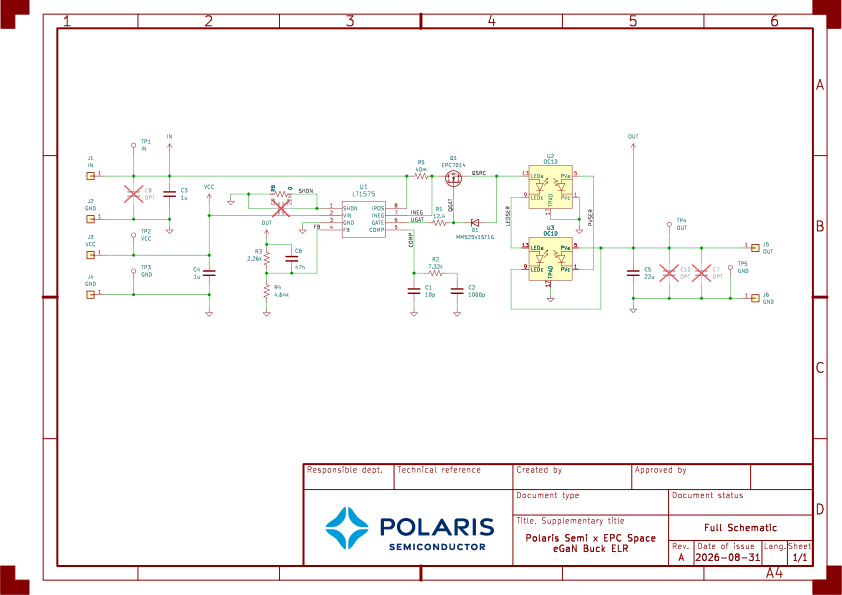
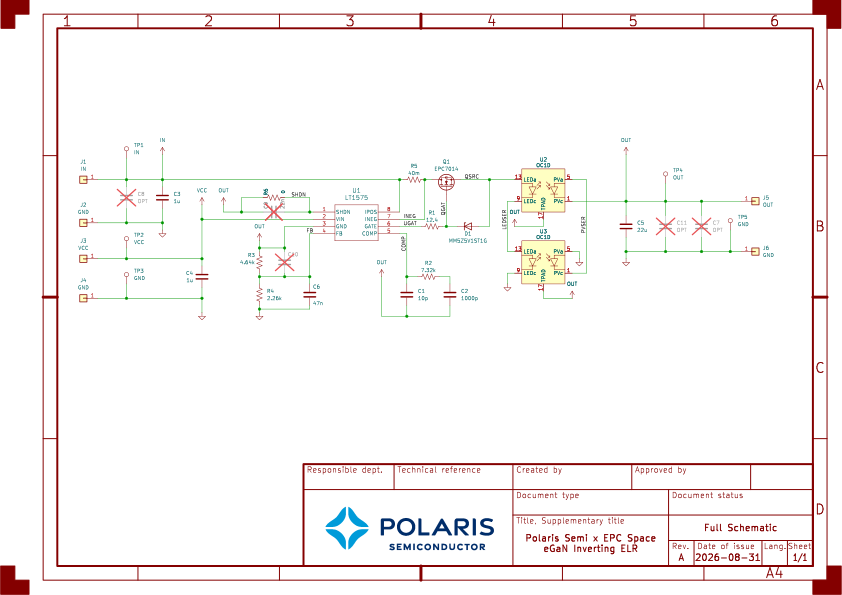
Full schematics for each board are provided in Figures A1–A4. Regulation operates through the same basic principles across all variants: LT1575’s (U1) error amplifier compares its FB pin against an internal 1.21 V reference and continuously adjusts the gate of EPC7014 (Q1). This is entirely representative of the regulation scheme in conventional LDOs; here it is separated into discrete controller and pass transistor elements.
By including a rail separate from , we have taken the controller and gate drive out of the power path. This minimizes the required headroom for conventional LDO operation—the dropout is set by the FET’s on-resistance rather than gate-drive headroom. The GATE pin of U1 swings to within approximately 1.6 V of (worst case; typically within 1 V), so the bias rail must satisfy:
where is the potential at Q1’s source and is the gate-to-source voltage (Q1 is fully enhanced at = 5 V). In the LDO design, the source ties directly to the output, giving > 8.4 V for fully enhanced operation at = 1.8 V; at moderate load and with adequate headroom, we found = 6 V sufficient in practice. The ELR variants relocate Q1’s source relative to the rails, with LED strings sitting directly in the pass-transistor path. Consult Table 2 for minimum recommended voltage in these configurations. represents the forward voltage across the series-connected LEDs (approximately 3.0 V, or 1.5 V per LED under high injection). For the results detailed herein, all boards had 12 V bias applied to unless noted otherwise.
| Configuration | Q1’s Source Potential () | Minimum , Fully Enhanced |
|---|---|---|
| LDO | 8.4 V | |
| Buck ELR | 11.4 V | |
| Boost ELR | 9.6 V | |
| Inverting ELR | 9.6 V |
Because sits well above Q1’s source, the GATE pin can drive past the +6 V absolute maximum rating of the EPC7014, a limit that must not be exceeded with GaN FETs [6]. Zener diode D1, connected from gate to source, clamps to 5.1 V during enhancement; its forward drop keeps negative excursions inside Q1’s −4 V reverse rating. A small series gate resistor (R1, 12.4 Ω) damps high-frequency ringing at the gate node for FETs with low input capacitance, per LT1575 datasheet recommendations [4].
We placed a 40 mΩ resistor (R5) in the power path between the IPOS and INEG terminals of U1. This triggers the controller’s current limit feature when the potential between those terminals reaches 50 mV. R5 therefore limits the pass transistor current to approximately 1.25 A. In the LDO this is the output current limit2. Q1’s on-resistance () is specified as 340 mΩ typical (1 A drain current, = 5 V, and 25 °C), so the two elements in series set a total -to-Q1-source drop of approximately 380 mV at full 1 A load3. In many applications, the added benefit of a current limiting feature outweighs the drawback of the additional tens-of-mV drop. Note that carries a positive temperature coefficient, reaching roughly 1.7× its room-temperature value at 125 °C. Dropout budget should be evaluated at the anticipated operating temperature.
U1’s SHDN pin is connected to ground via R6 using a 0 Ω jumper, defeating the current limit’s latchoff timer. In doing so, current limiting is implemented as a continuous clamp rather than a latching shutdown. Timed latch-off can be restored by swapping R6 for a high-impedance resistor or leaving it open, and populating C9 (unpopulated in reference design)4.
Loop compensation follows LT1575 datasheet’s recommended series RC-plus-capacitor (type-II) network: R2 (7.32 kΩ) in series with C2 (1000 pF) from the COMP pin to ground, with C1 (10 pF) in parallel. Properly compensated, the ultrafast error amplifier maintains tight regulation with all-ceramic output capacitors—C5 is a single 22 µF ceramic, with no bulk tantalum or electrolytic capacitance required. Input and bias bypassing are handled by 1 µF ceramics C3 and C4 on and , respectively. Unpopulated positions C7, C8, and C10 (C11 on the Inverting board) accommodate additional output and input capacitance if desired. All fitted capacitors use X7R or C0G dielectrics, chosen for their stable capacitance across temperature.
The output voltage is programmed by the voltage divider: R3 connects between the output and U1’s FB pin, R4 between the FB and ground. A 47 nF feedforward capacitor (C6) is used to improve transient response and minimize output noise. For the positive-output designs, = 1.21 V × (1 + R3/R4); R3 = 2.26 kΩ and R4 = 4.64 kΩ give 1.8 V for the LDO and Buck ELR. The Inverting ELR retains the same three components but rearranges the reference—as described in the Inverting ELR paragraph below.
From LDO to ELR
Each variant is built on the same foundational bill of materials (BoM), collected in Table A1. Moving from the LDO to any of the ELRs populates optocouplers U2 and U3, reroutes Q1’s source and the optocoupler terminals, and, where the output voltage differs (Boost and Inverting ELRs), changes R3 and R4 values. These adjustments, along with relatively minor layout shifts, were all that was necessary for the broad range of regulation schemes demonstrated. This highlights the adaptability of the optocoupler-enhancement technique and the ease of ELR design-in as an extension of baseline LDO design. Table 3 collects the circuit relations that follow from rewiring. Here, is the forward drop of the two series-connected LEDs; is the drop across R5 and Q1; and CTR is the optocoupler current transfer ratio—the PV photocurrent divided by the LED current that produced it. Load current () is the magnitude delivered to the load. The current ratios neglect the divider current and the controller supply current, which is drawn from rather than . All three ELR boards connect the two LEDs in series and the two PVs in series, and the current ratios in Table 3 assume this arrangement. Parallel arrangements optimize performance for different operating regimes, and PSWP001 generalizes the Buck and Boost relations to any series–parallel combination [3].
| Configuration | LED string | PV string | PV string voltage | Turn-on voltage () | carried by | |
|---|---|---|---|---|---|---|
| LDO | — | — | — | Q1 | ||
| Buck ELR | Source to OUT | GND to OUT | Q1 and PVs | |||
| Boost ELR | Source to GND | IN to OUT | PVs | |||
| Inverting ELR | Source to GND | OUT to GND | a | PVs |
- a See the section entitled “Design Note: Inverting ELR and Implied CTR” for a more nuanced discussion related to this expression.
In the Buck ELR, the LED array sits between Q1’s source and the output; the PV pair sits between ground and the output, in parallel with the load. In this way, the load current is the sum of the pass-transistor current and the photocurrent. The input supplies only the LED share, , which is how an ELR exceeds the efficiency ceiling of a conventional LDO [3]. The turn-on voltage () rises by , marking another key distinction from conventional LDOs: the latter suits small input-to-output steps, where little power is lost in the pass transistor. The Buck ELR is designed for larger steps, where the LEDs convert the drop into light that the PV elements return to the output as current. Note that the R5 current limit now bounds the LED current, rather than the load current, so the load current limit becomes approximately 1.25 A × (1 + CTR).
The Boost ELR moves the LED pair to ground and the PV pair to the input, such that the PV voltage adds to , thereby achieving boost conversion with no inductor and no switching. The divider still sets the output; R3 = 7.15 kΩ and R4 = 2.26 kΩ give 5.04 V. The loop drives LED current until the PV pair produces the difference . By applying two optocouplers with series-connected PV elements, the Boost ELR covers the step from a single-cell Li-ion input of 3.3–4.2 V to 5 V. All of the load current passes from the input through the PV array, so the input current equals the load current plus the LED current, . The turn-on voltage loses its term, because the LEDs are now connected to ground. Q1’s source rests at above ground, which is the origin of the 9.6 V entry in Table 2. A fuller treatment of linear boost operation is given in PSAN001 [7] and PSWP001 [3].
The Inverting ELR keeps the LED placement of the Boost ELR and moves the PV pair from between the input and output to between ground and the output. Its positive terminal is tied to ground; its negative terminal becomes the rail, following the negative voltage arrangement in the OC1D datasheet [8]. All of the load current again passes through the PV array, so Q1 carries . Because U1’s FB pin must sit 1.21 V above its GND pin, we tie the latter pin to the −1.8 V output and the divider spans from system ground to that rail. This necessitates swapping the R3 & R4 resistor values relative to the LDO and Buck ELR boards: R3 = 4.64 kΩ and R4 = 2.26 kΩ. The SHDN circuit and compensation network both return to the −1.8 V output rail as well. The bias rail is still applied relative to system ground, so the 9.6 V minimum in Table 2 holds, with U1 seeing 11.4 V across its own supply pins.
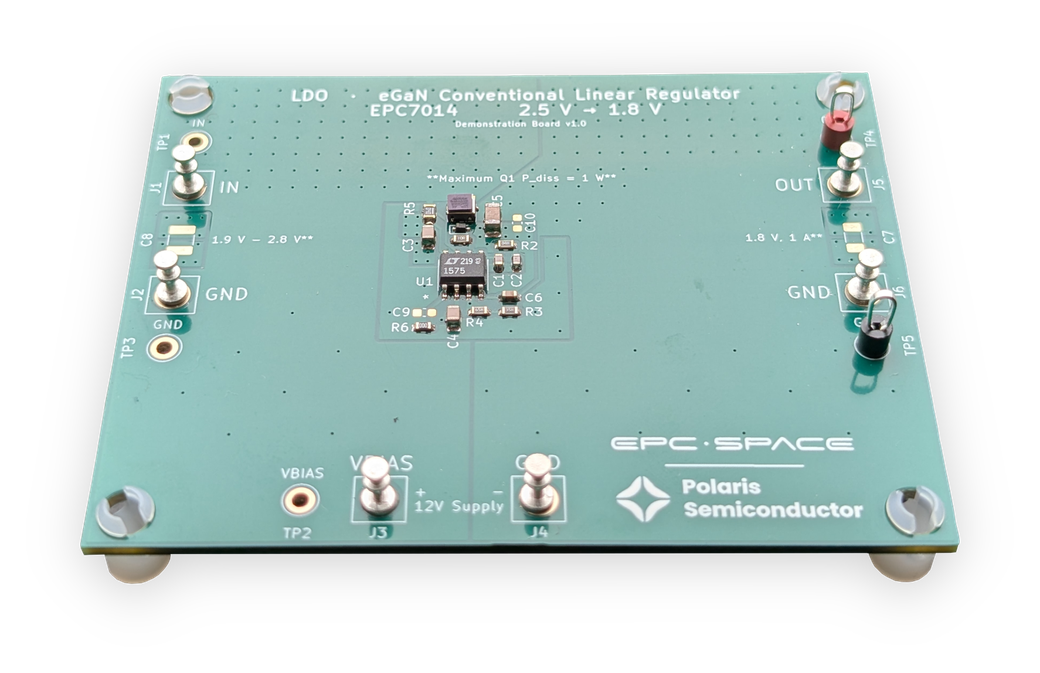
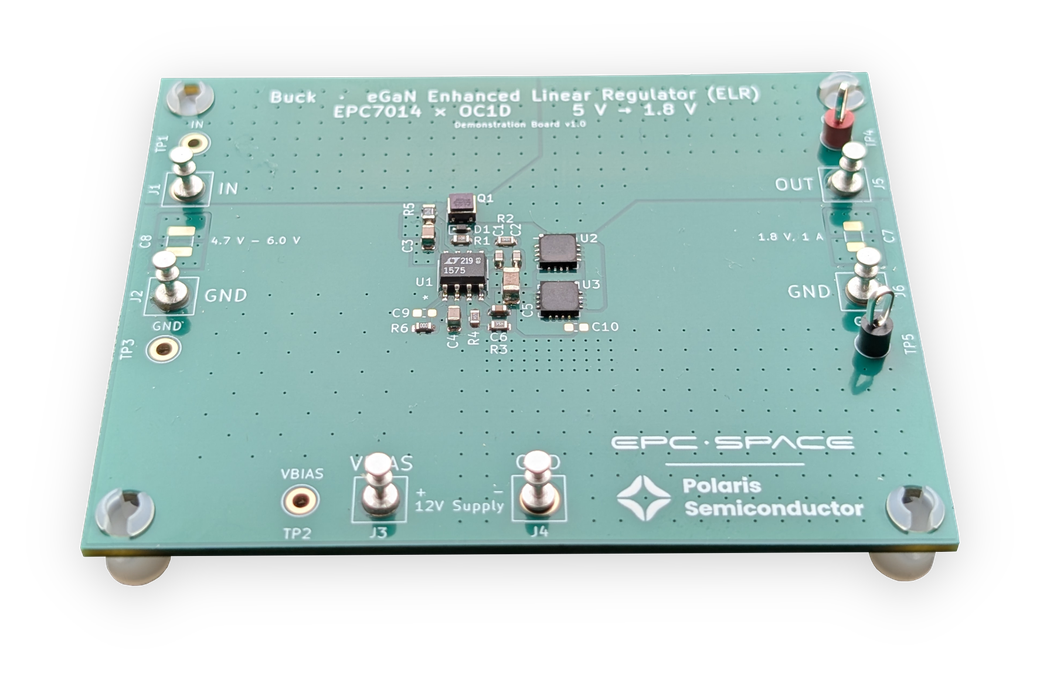
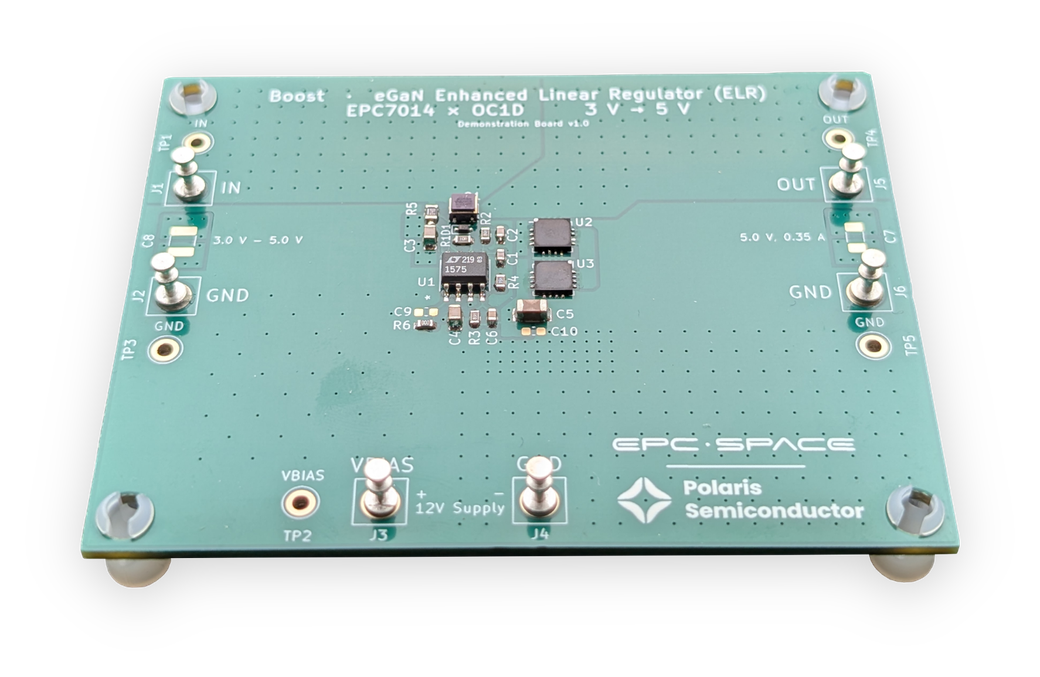
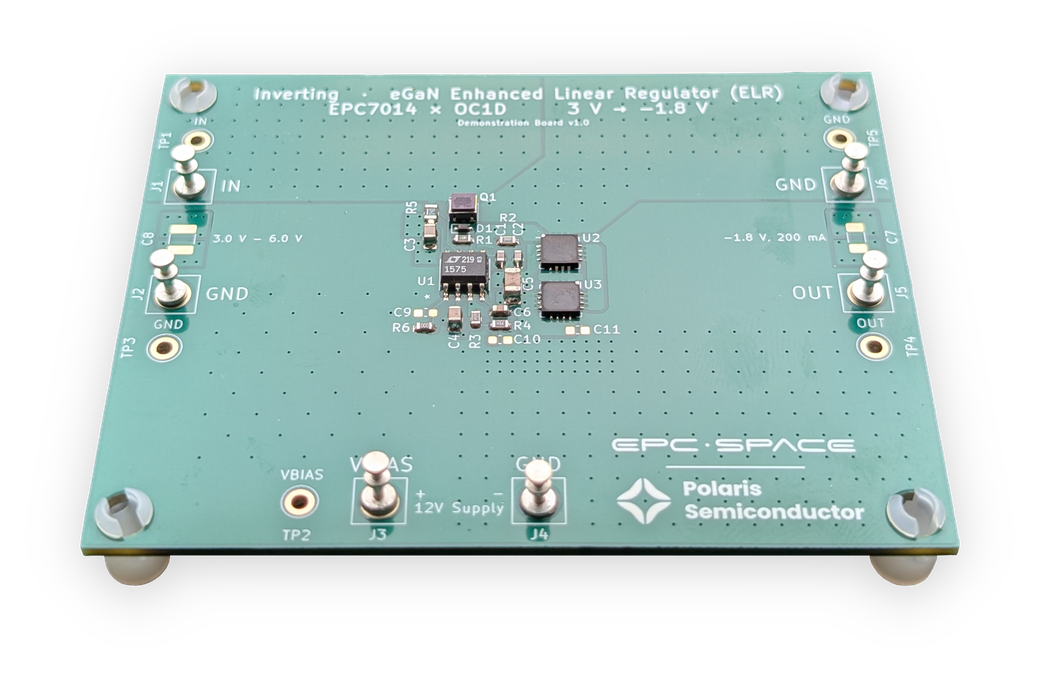
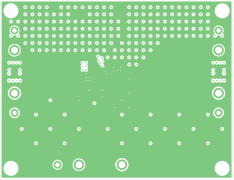
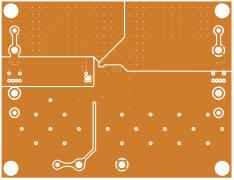
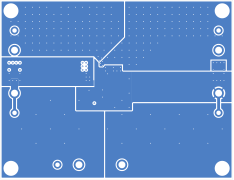
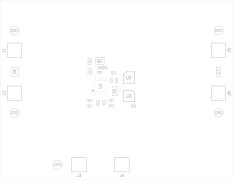
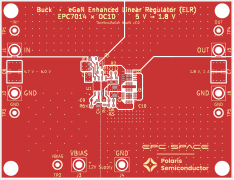
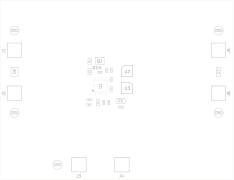
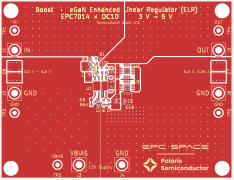
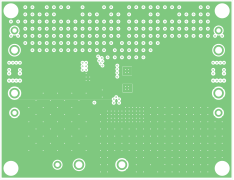
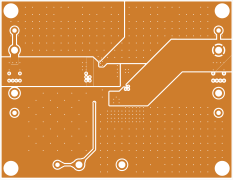
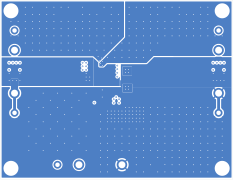
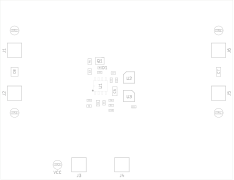
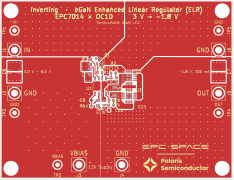
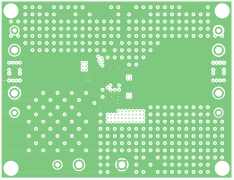
All four boards share the same 82.6 mm × 63.5 mm four-layer outline. Figure 2 shows the assembled boards.
Measured Performance
Electrical tests are summarized in Figure 3 for all demonstration boards. Each topology tile stacks output voltage (top) over efficiency (bottom) on a shared input voltage axis. Unless otherwise specified, electrical tests in this application note do not account for the separate bias rail current, which is typically ≈ 12 mA or less [4].
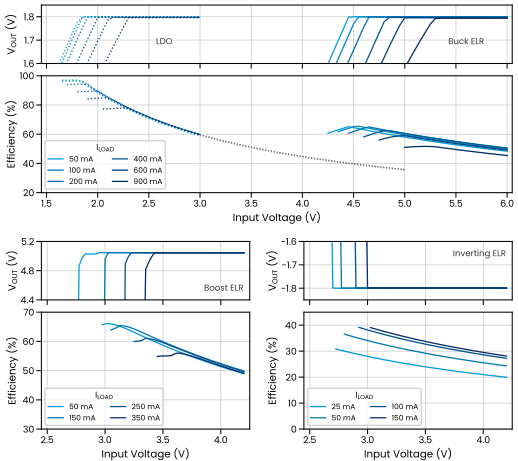
The top set of panels in Figure 3 shows the electrical performance of both the LDO and Buck ELR on shared axes. Given that both boards regulate 1.8 V output, the subplots provide a visual aid in ascertaining the optimal operating regime of each design. The LDO (dotted lines) is highly efficient and capable of regulation when the input voltage is only slightly above the output. The Buck ELR (solid lines), on the other hand, turns on at a higher input, as expected from the LED forward drop, but reaches far higher efficiency in its own operating regime. For comparison, stepping 5 V to 1.8 V is only about 36% efficient using an LDO; with the Buck ELR, efficiency is approximately 60% (precise value is load-current dependent)—a 67% relative increase5.
The bottom left and right panels show complementary electrical performance summaries for the Boost ELR and Inverting ELR, respectively. Efficiencies are only plotted above the turn-on voltage to avoid calculation artifacts associated with the extremely sharp sub-regulation output voltage swing. The Boost ELR is able to achieve approximately 60% efficiency for a single-cell Li-ion step to 5 V (from 3.5 V to 5 V), whereas the Inverting ELR converts 3.5 V to −1.8 V with lower efficiency in the range of mid-20s-to-mid-30s percent. It is worth noting that negative rails are often just needed to set a negative bias point and therefore draw very little current. In these cases, electrical efficiency is of minimal concern when compared with power integrity (zero switching spurs, extremely low output noise) and footprint/BoM. For these designs the Inverting ELR offers a switching-free negative rail at a cost of two optocouplers and no inductor.
| Configuration | Input Current | Implied CTR |
|---|---|---|
| LDO | 101 mA | — |
| Buck ELR | 60 mA | 67% |
| Boost ELR | 242 mA | 70% |
| Inverting ELR | 157 mA | 71% a |
- a See the section entitled “Design Note: Inverting ELR and Implied CTR” for details on the Inverting ELR CTR calculation.
Table 4 tells the efficiency story in another way: reporting each configuration’s input current required to supply a 100 mA load. The input currents are reported at an input voltage above turn-on, where its relationship with input voltage is relatively invariant. The reduction in input current between the LDO and Buck ELR, from 101 mA to 60 mA, exemplifies the benefit of using Polaris optocouplers in this circuit topology; input current needed to supply a given output current is significantly reduced without the drawbacks of switching or magnetic components. In the last column of Table 4, the optocouplers’ CTR is calculated using the expressions defined in Table 3. The range of 67%–71% agrees with expectations given that CTR varies with LED injection current, and a 100 mA load implies different injection current levels for the different configurations. For the Buck and Inverting ELRs, input current will be equivalent to the LED injection current. The Boost ELR’s input current is split between two paths: 1) the pass transistor and LEDs; and 2) the PVs and load. Thus, LED injection current for the Boost ELR was approximately 142 mA when supplying 100 mA to the load. The calculated CTR values are in good agreement with our OC1D datasheet [8]; for this size of optocoupler, the CTR peaks between approximately 100 mA and 200 mA LED injection current.
Figure 4 compares load regulation across the four boards, each measured at a fixed input voltage (5.5 V, 2.5 V, 3.5 V, and 3.3 V for the Buck ELR, LDO, Boost ELR, and Inverting ELR, respectively). In order to provide an “apples-to-apples” comparison, each trace plots the change in relative to its own value at 100 mA load current—a percent change. This allows us to compare the 5 V output Boost ELR with the other three while controlling for feedback divider error, which would be nearly 3× higher for a 5 V output relative to 1.8 V. Additionally, by plotting the magnitude of the output, the Inverting ELR shares sign convention with the other three topologies. In all four designs, the output voltage moves toward zero with increasing load. The Boost ELR and LDO track each other at approximately −0.2%/A, while the Buck and Inverting ELRs run about a factor of two steeper. In absolute terms every slope is below 10 mV/A, from 3.6 mV/A for the LDO to 9.1 mV/A for the Boost ELR, equivalent to a closed-loop output resistance under 10 mΩ.
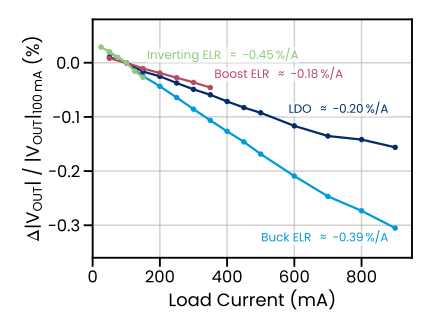
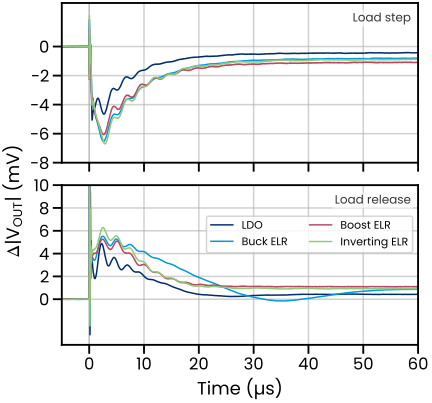
Figure 5 shows how each board recovers from a load step of 87–98 mA and from the matching release, with Table 5 reporting the dip, overshoot, settled shift, and settling time. Each board was tested at the same input voltage as in the load regulation test, and the output was probed at the output-capacitor pad with 20 MHz bandwidth and a 100-trace average. As in Figure 4, the magnitude of the output is plotted so the Inverting ELR shares the sign convention of the other three. The three ELRs are largely indistinguishable from one another: each dips 6–7 mV, overshoots 5–6 mV on release, rings briefly at a few hundred kilohertz, and settles within 2 mV in 9–16 µs, whether the optocouplers are arranged for step-down, step-up, or inversion. The LDO responds slightly faster and dips 1–1.5 mV less, which is consistent with the ELRs’ LED pair in series with Q1’s source: its dynamic resistance lowers the loop’s effective transconductance, and with it the crossover frequency, by a modest amount. The settled voltage shift after each load change, 0.4–1.0 mV, matches the load-regulation slopes of Figure 4 for the same current step to within 0.25 mV. Because nothing switches, the response contains no component at a switching frequency for a downstream clock or oscillator to pick up. Thus, the transient response is that of the feedback loop itself, which the optocouplers leave essentially untouched.
| Configuration | Step dip | Release overshoot | Settled shift | Settling time, step | Settling time, release |
|---|---|---|---|---|---|
| LDO | −5.1 mV | 4.9 mV | 0.4 mV | 6 µs | 9 µs |
| Buck ELR | −6.5 mV | 5.5 mV | 0.7 mV | 10 µs | 16 µs |
| Boost ELR | −6.1 mV | 5.3 mV | 1.0 mV | 9 µs | 10 µs |
| Inverting ELR | −6.7 mV | 6.3 mV | 0.8 mV | 9 µs | 11 µs |
LDO vs. Buck ELR Use Cases
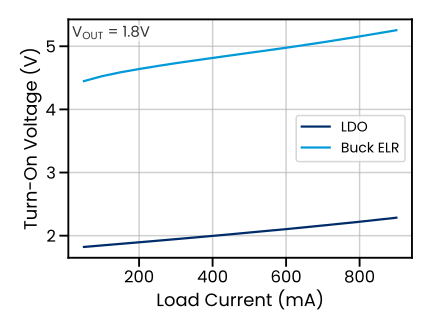
Turn-on voltage versus load current is plotted in Figure 6 for the LDO and Buck ELR at 25 °C. This defines the input voltage range over which each board regulates. Both curves rise with load, because and the drop across R5 and Q1 grow with current, so the designer must check the minimum input voltage against at the maximum anticipated load rather than a nominal one. The LDO regulates from an input within 0.5 V of the output across the full 900 mA sweep and is the appropriate choice when the input rail sits close to the output. If the LDO-powered board was fed with 5 V, nearly two thirds of the input power would be dissipated in Q1 as illustrated in Figure 3. This is the regime that the Buck ELR was optimized to address: a stiff 5 V input regulates at up to 600 mA load. For operation at heavier loads, or with assured regulation across a wider input range, there are two convenient options when working with Polaris parts. The first, demonstrated in PSAN004, is a bypass path around the LED pair that automatically returns the ELR to conventional LDO operation whenever the input falls below a set threshold voltage [9]. Another option is to connect the two LEDs in parallel rather than in series, which lowers by one LED forward drop and moves the Buck ELR’s operating range into the gap between the two curves in Figure 6.
Efficiency is one way to visualize the value of selecting an ELR for larger voltage steps. Another is thermal imaging, provided in Figure 7. We applied the same operating conditions of 5.5 V input, 1.8 V output supplying a 200 mA load to both the LDO and Buck ELR boards. On the LDO board, Q1 registered a maximum temperature of approximately 60 °C under these conditions—far hotter than any other component on the board. On the Buck ELR under identical conditions, Q1 wasn’t even the hottest component; U1 was, at approximately 39 °C. Two things are evident from Figure 7: the maximum temperature is significantly lower on the Buck ELR board, and its heat is more evenly distributed. The second point follows from where the power is routed. In the LDO nearly all of it is dissipated in Q1, whereas in the Buck ELR that dissipation is shared among Q1, U2, and U3. In total, the LDO and Buck ELR boards were measured to dissipate 788 mW and 335 mW, respectively, under these operating conditions (bias rail dissipation included). Table 6 summarizes the electrical operating point behind the two images.
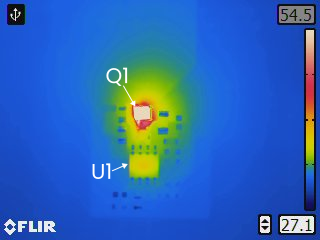
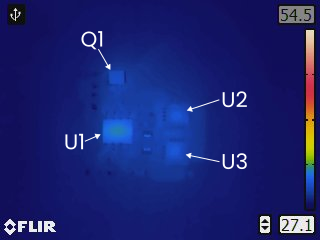
| LDO | Buck ELR | |
|---|---|---|
| (V) | 5.5 | 5.5 |
| (mA) | 200 | 119 |
| (V) | 9 | 9 |
| (mA) | 5 | 4 |
| (V) | 1.790 | 1.783 |
| (mA) | 199.5 | 199.6 |
| (mW) | 788.0 | 334.5 |
Figure 8 extends the thermal comparison across load current. For each board we recorded the maximum temperature rise above ambient () at a series of steady-state operating points, all stepping 5.5 V down to 1.8 V, and plotted it against total dissipated power (, bias rail included) and against total output power. Measurements were performed in a 25 °C ambient with natural convection, and a FLIR camera was used to quantify the maximum temperature on each board. The camera was set to a fixed emissivity of 0.95, which we take as a reasonable approximation for the packaged components on these boards. At low dissipated power, U1 was the hottest component on both boards: its own dissipation is nearly independent of load, so it sets a floor of roughly 10 °C that the power-path components must exceed before they take over as the hotspot. On the LDO board, Q1 overtook U1 by approximately 0.45 W of total dissipation. On the Buck ELR board, U1 remained the hotspot until more than 1 W, and when a power-path component finally overtook it, that component was an optocoupler (U2 and U3 ran at nearly equal temperatures, as expected for the series-connected components) rather than Q1. A linear fit to max versus over the points where the power-path part registers the hotspot gives an effective thermal resistance—hotspot rise per watt of total board dissipation—of 46.5 °C/W for the LDO board and 23.3 °C/W for the Buck ELR board. The two boards share the same outline and layer stack, so this factor-of-two reduction comes largely from dividing the dissipation among three packages rather than concentrating it in one.
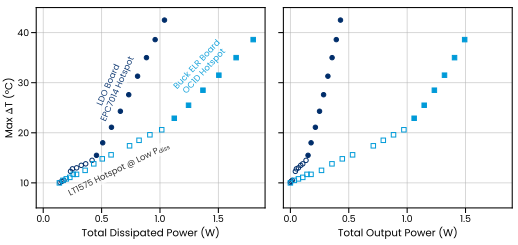
The right panel replots the same data against total output power, which is the view a designer sizing a rail cares most about. Here the efficiency and thermal advantages compound: at the same maximum temperature rise, the Buck ELR board delivers more than three times the output power of the LDO board.
Noise & Ripple
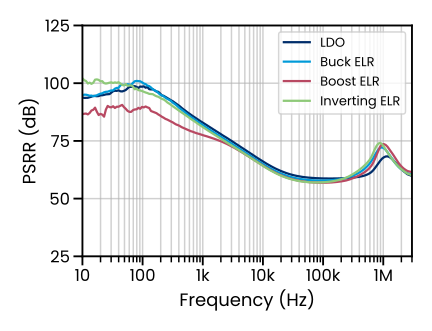
Power supply ripple rejection (PSRR)—the ratio of ripple arriving at the input to the ripple persisting at the output—is plotted in Figure 9 for all four boards at 100 mA load, each supplied from an input between 0.5 V and 1 V above its turn-on voltage. The three boards regulating to 1.8 V in magnitude (LDO, Buck ELR, Inverting ELR) track one another within about 3 dB from 10 Hz to 300 kHz: each rejects 95 dB to 100 dB at low frequency, then falls gradually above 200 Hz to a floor of roughly 58 dB. The Boost ELR is the exception, holding 87 dB to 90 dB below 200 Hz, roughly 10 dB under the other three. The most likely cause is its output voltage of 5 V rather than 1.8 V. Its feedback divider lowers loop gain by 1 + R3/R4, which is 4.2 against 1.5 for the 1.8 V boards, a 2.8× or 9 dB reduction, so the divider alone predicts nearly all of the observed gap. The feedforward capacitor C6 mitigates this penalty: above a few hundred hertz the divider’s attenuation rolls off toward unity, and by 3 kHz the four traces have converged. A second, smaller contribution may come from the topology itself. In the Boost ELR the PV pair bridges input and output, so input ripple reaches the output node directly and must be cancelled by the loop rather than blocked by the pass transistor, as it is in the other three boards. Our earlier boost-versus-buck comparison of a co-packaged part at matched output voltage measured that effect at approximately 5 dB [7]; here, with the divider already accounting for most of the gap, it appears to be the lesser factor. All four boards recover to between 68 dB and 74 dB near 1 MHz, which coincides with the self-resonance of C5, where the impedance of the single 22 µF ceramic is lowest; no bulk capacitor or additional filtering was needed. Among Polaris Semiconductor’s ELR families, only BK30 rejects more: at 100 Hz the 1.8 V boards’ 100 dB sits just below BK30’s greater than 100 dB and well above the 75 dB of BK19.
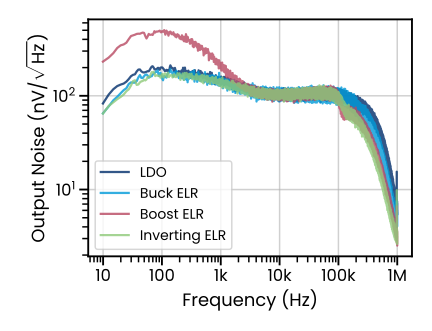
Output noise spectral density—the noise voltage found in each 1 Hz slice of the spectrum—is plotted in Figure 10 for all four boards at 100 mA load. The three boards regulating to 1.8 V in magnitude (LDO, Buck ELR, Inverting ELR) are nearly indistinguishable from 10 Hz to 1 MHz. This supports our general findings that the incorporation of optocouplers in any of these arrangements leaves its output noise essentially that of the underlying regulator. The Boost ELR was expected to register higher noise at low frequency, and it does, by a factor of about 2.8 at 100 Hz. The cause is its 5 V output rather than its optocouplers. The same feedback divider that lowered its low-frequency PSRR also amplifies the controller’s reference and error-amplifier noise by 1 + R3/R4, and the 2.8 ratio between the two divider factors is the ratio seen in the figure. As with PSRR, C6 rolls the noise gain off toward unity above a few hundred hertz, and by 3 kHz the four traces have converged. Table 7 integrates the same spectra from 10 Hz–100 kHz, yielding 35 µVRMS for the three 1.8 V magnitude boards and 41 µVRMS for the 5 V Boost ELR board.
| Configuration | Output Noise |
|---|---|
| LDO | 35 µVRMS |
| Buck ELR | 35 µVRMS |
| Boost ELR | 41 µVRMS |
| Inverting ELR | 35 µVRMS |
Conclusions
This application note has shown, on four boards sharing one controller, one eGaN pass transistor, and one bill of materials, that linear regulation for space now covers voltage steps that were previously left to switching converters. Each board is tailored to a different operational range. The LDO regulates from an input within approximately 0.5 V of its 1.8 V output across a 1 A load sweep, with better than 90 dB of low-frequency ripple rejection, and it is the efficient answer for small voltage steps. The Buck ELR picks up where the LDO’s range ends, supplying the same 1.8 V from a 5 V input at approximately 60% efficiency and drawing 60 mA to serve a 100 mA load. Run side by side at 5.5 V input and 200 mA load, the two boards show what the optocouplers recover: 335 mW dissipated on the Buck ELR board against 788 mW on the LDO, a hotspot that rose 23.3 °C per watt against 46.5 °C/W, and more than three times the output power at equal temperature rise. The Boost ELR produces a 5 V rail from a single-cell Li-ion input at approximately 60% efficiency, and the Inverting ELR produces −1.8 V from 3.5 V with no inductor and no switching, at the minimal cost of two optocouplers. All four boards hold output noise to 35–41 µVRMS.
EPC Space’s eGaN takes away the gate-oxide rupture and burnout mechanisms that bound rad-hard silicon MOSFETs under heavy ions, and Polaris Semiconductor’s optocouplers take away the efficiency ceiling and exclusively-step-down limitation that have confined linear regulation to small voltage steps, so a spacecraft’s most noise-sensitive rails can be served linearly across large drops, step-up, and inversion. The boards here use discrete parts sized for standard logic rails, with a commercial silicon controller closing the loop. Other input-output pairs follow from the number of optocouplers and the series or parallel arrangement of their LEDs and photovoltaic elements, and co-packaging the same elements shrinks the footprint well below that of alternative switching solutions. Future versions may go further and implement the error amplifier in GaN as well. Demonstration boards are planned for availability through Polaris Semiconductor, and custom configurations and co-packaging are supported jointly by EPC Space and Polaris Semiconductor.
Appendix
LDO Schematic
Buck ELR Schematic
Boost ELR Schematic
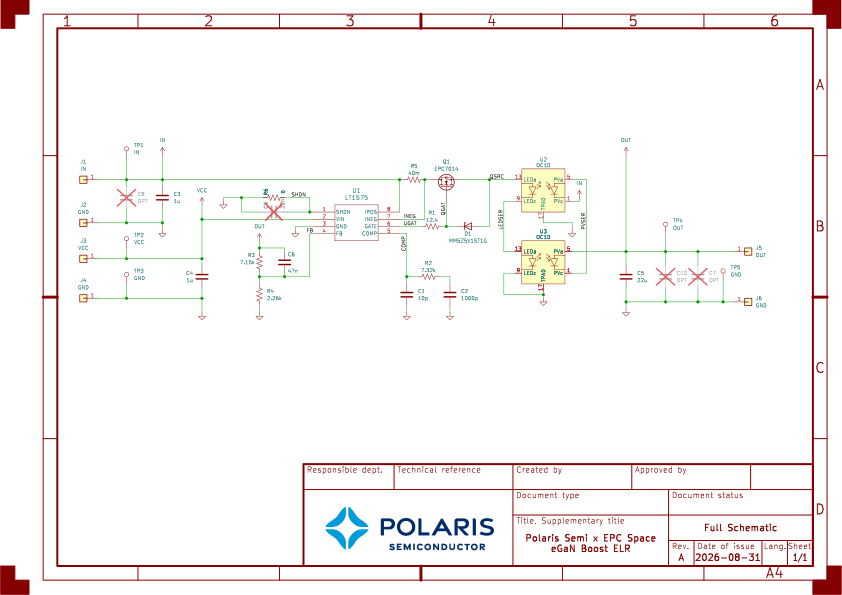
Inverting ELR Schematic
LDO PCB Layout
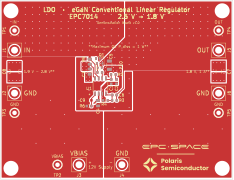
Buck ELR PCB Layout
Boost ELR PCB Layout
Inverting ELR PCB Layout
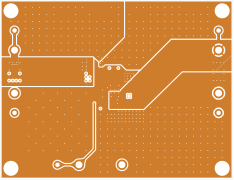
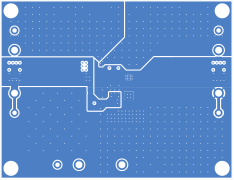
eGaN × ELR Bill of Materials
| ID | LDO | Buck | Boost | Inv. | Description | Part | Manufacturer |
|---|---|---|---|---|---|---|---|
| C1 | ● | ● | ● | ● | 10 pF ceramic C0G | CL10C100JB81PNC | Samsung Electro-Mechanics |
| C2 | ● | ● | ● | ● | 1000 pF ceramic C0G | CL10C102JB81PNC | Samsung Electro-Mechanics |
| C3, C4 | ● | ● | ● | ● | 1 µF ceramic X7R | GCM21BR71E105KA56L | Murata Electronics |
| C5 | ● | ● | ● | ● | 22 µF ceramic X7R | CL31B226KPHNNNE | Samsung Electro-Mechanics |
| C6 | ● | ● | ● | ● | 47 nF ceramic X7R | CL10B473KB8WPNC | Samsung Electro-Mechanics |
| C7 | ○ | ○ | ○ | ○ | Extra output cap., 1206 | — | — |
| C8 | ○ | ○ | ○ | ○ | Extra input cap., 1210 | — | — |
| C9 | ○ | ○ | ○ | ○ | Latch-off timing cap., 0603 | — | — |
| C10 | ○ | ○ | ○ | Extra output cap., 0603 | — | — | |
| C10 | ○ | FB-to-OUT cap., 0603 | — | — | |||
| C11 | ○ | Extra output cap., 0603 | — | — | |||
| D1 | ● | ● | ● | ● | 5.1 V Zener, 500 mW | MM5Z5V1ST1G | onsemi |
| J1–J6 | ● | ● | ● | ● | Turret terminal pin | 2501-2-00-80-00-00-07-0 | Mill-Max Manufacturing Corp. |
| Q1 | ● | ● | ● | ● | Rad-hard eGaN HEMT | EPC7014UBC | EPC Space |
| R1 | ● | ● | ● | ● | 12.4 Ω 0.5% 1/16W | RR0816Q-12R4-D-10R | Susumu |
| R2 | ● | ● | ● | ● | 7.32 kΩ 0.5% 1/16W | RR0816P-7321-D-84H | Susumu |
| R3 | ● | ● | 2.26 kΩ 0.5% 1/16W | RR0816P-2261-D-35H | Susumu | ||
| R3 | ● | 7.15 kΩ 0.5% 1/16W | RR0816P-7151-D-83H | Susumu | |||
| R3 | ● | 4.64 kΩ 0.5% 1/16W | RR0816P-4641-D-65H | Susumu | |||
| R4 | ● | ● | 4.64 kΩ 0.5% 1/16W | RR0816P-4641-D-65H | Susumu | ||
| R4 | ● | ● | 2.26 kΩ 0.5% 1/16W | RR0816P-2261-D-35H | Susumu | ||
| R5 | ● | ● | ● | ● | 40 mΩ 1% 1/8W | PE0805FRF070R04L | Yageo |
| R6 | ● | ● | ● | ● | 0 Ω jumper, 0603 | 560112116001 | Würth Elektronik |
| TP1, TP2, TP4 | ● | ● | ● | ● | Test point, red | 5010 | Keystone Electronics |
| TP3, TP5 | ● | ● | ● | ● | Test point, black | 5011 | Keystone Electronics |
| U1 | ● | ● | ● | ● | Linear controller, SO-8 | LT1575CS8#PBF | Analog Devices |
| U2, U3 | ● | ● | ● | Photovoltaic optocoupler | OC1DQ16 | Polaris Semiconductor |
References
- ”Radiation performance of enhancement-mode gallium nitride power devices.” EPC Space; Application Note AN001, 2022. Available: https://epc.space/documents/application-notes/AN001%20Radiation%20Performance%20of%20eGaN%20Power%20Devices.pdf
- EPC7014UBC 60 V Radiation Hardened Power eGaN® Datasheet. EPC Space; Datasheet, 2026. Available: https://epc.space/documents/datasheets/EPC7014UBC-datasheet.pdf
- M. P. Lumb, K. J. Schmieder, J. DeLombard, J. Carlin, L. Kaliszewski, A. Price, D. Hollingshead, and T. Grassman, “Breaking the rules of linear regulators: High efficiency buck and boost conversion without switching.” Polaris Semiconductor; White Paper PSWP001, 2025. Available: https://www.polarissemiconductor.com/techdocs/elr-white-paper
- LT1575 Ultrafast Transient Response, Low Dropout Regulators Adjustable and Fixed. Analog Devices; Datasheet, 1996. Available: https://www.analog.com/media/en/technical-documentation/data-sheets/15757f.pdf
- M. P. Lumb, K. J. Schmieder, L. Sanchez, and A. Radosevich, “Generating low-noise negative rails from positive supplies without switching.” Polaris Semiconductor; Application Note PSAN005, 2026. Available: https://www.polarissemiconductor.com/techdocs/psan005-inverting-regulator
- A. Pozo, “Using GaN FETs with controllers and gate drivers designed for silicon MOSFETs.” Bodo’s Power Systems, 2024. Available: https://epc-co.com/epc/Portals/0/epc/documents/articles/bp-022024.pdf
- K. J. Schmieder and M. P. Lumb, “Switching-free boost regulators: A compact, all-linear solution to stepping-up voltage.” Polaris Semiconductor; Application Note PSAN001, 2025. Available: https://www.polarissemiconductor.com/techdocs/psan001-switching-free-boost
- OC1D 1.2V-1.7V Input, 1V Output, Photovoltaic Optocoupler. Polaris Semiconductor; Datasheet, 2024.
- K. J. Schmieder and M. P. Lumb, “Designing for multiple power sources: Seamless performance optimization with enhanced linear regulators.” Polaris Semiconductor; Application Note PSAN004, 2026. Available: https://www.polarissemiconductor.com/techdocs/psan004-multi-source-power
Footnotes
-
The Boost ELR also connects them to the input terminal. ↩
-
An explanation of how this differs in ELR variants follows in the next section. ↩
-
The measured dropout in Figure 3 is somewhat larger, roughly 0.5 V at 900 mA, which likely reflects Q1’s positive tempco under self-heating together with board interconnect resistance. ↩
-
For example, 22 nF yields approximately 1.6 ms latch-off time. ↩
-
Perhaps Figure 3 leaves you wondering whether ELRs can be optimized to address the input voltages spanning the gap between the demonstrated Buck ELR and LDO. We’re happy to say it is as simple as configuring the two LEDs in parallel rather than in series. Many of our co-packaged ELR parts are configured such that pinout connections can adjust the LED array between series and parallel strings—in addition to a bypass mode for running the ELR package like an LDO—facilitating optimization across a wide range of input voltages for any given part [3], [9]. ↩
Ready to design it in?
Request evaluation samples, detailed datasheets, and SPICE models — an engineer answers, not a sales funnel.